Graphy - The fastest way to visualize and share your data
📊Transform your scattered data into stunning reports with Graphy! 🚀 Consolidate data from various tools effortlessly and create shareable, interactive views in minutes. Say goodbye to reporting nightmares! 🌟 #AI #dataviz #Graphy
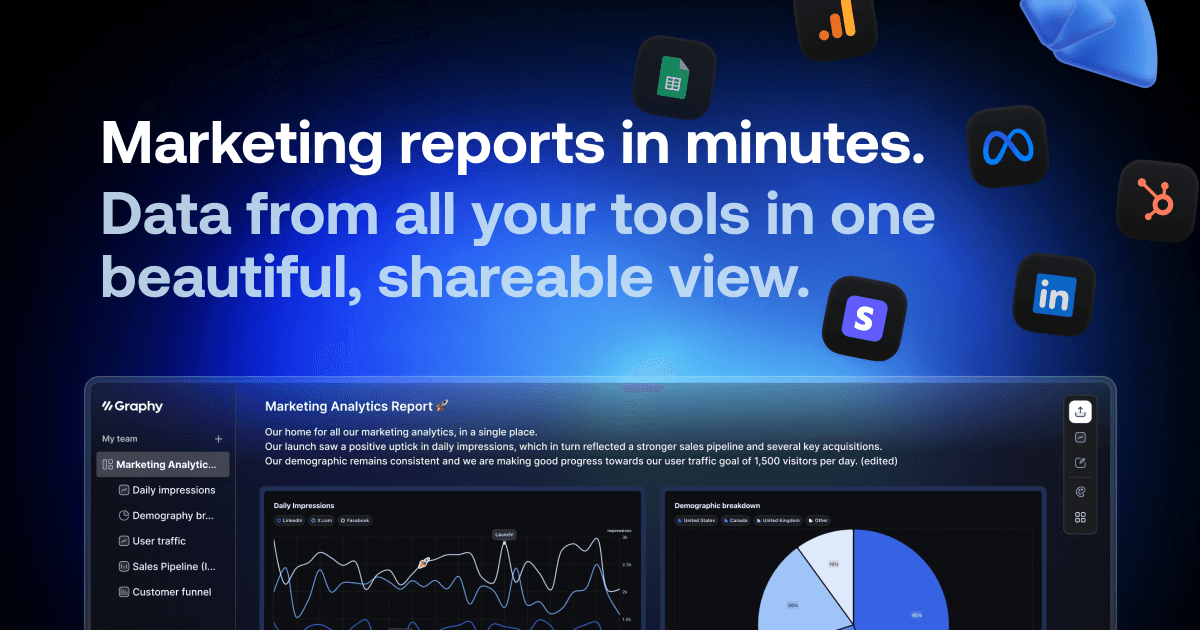
- Graphy creates marketing reports in minutes by consolidating data from various tools into a shareable view.
- It is as easy to use as taking a screenshot but as powerful as a comprehensive dashboard.
- Users can create stunning charts with context and commentary for better understanding of the data.
- Graphy aims to eliminate reporting nightmares caused by scattered data and slow dashboards.
- With AI-powered insights, users can save time by 80% in creating reports.
- Users can import data from multiple sources with one click, without the need for complex integrations or data analysts.
- Graphy allows users to explore and explain data easily, creating interactive reports to wow audiences.
- Interactive boards can be shared via email, Slack, Teams, and other platforms for seamless collaboration.
- Graphy is designed to empower data-driven marketers by providing high-quality reports in less time and enabling rapid answers to ad-hoc questions.
- Users can save time, up their game, and ensure better understanding of their work's value with Graphy.
- Graphy offers unlimited graphs, data, and viewers for free, promising beautiful and interactive reports instantly.