ChartGPT
📊✨Transform your words into stunning visuals with ChartGPT! 🌈📈 Simply input your text and choose from a range of chart types, colors, and customization options to bring your data to life. Dive into engaging data visualization projects effortlessly! #dataviz #AI #ChartGPT
- Sign in with Google to access visualization features.
- Visualize data using various chart types like Bar, Line, Area, Pie, Scatter, Radar, Radial Bar, Funnel, or Treemap.
- Choose colors for the charts such as Blue, Purple, Green, Pink, or Yellow.
- Customize the chart with titles, legends, and other visual elements.
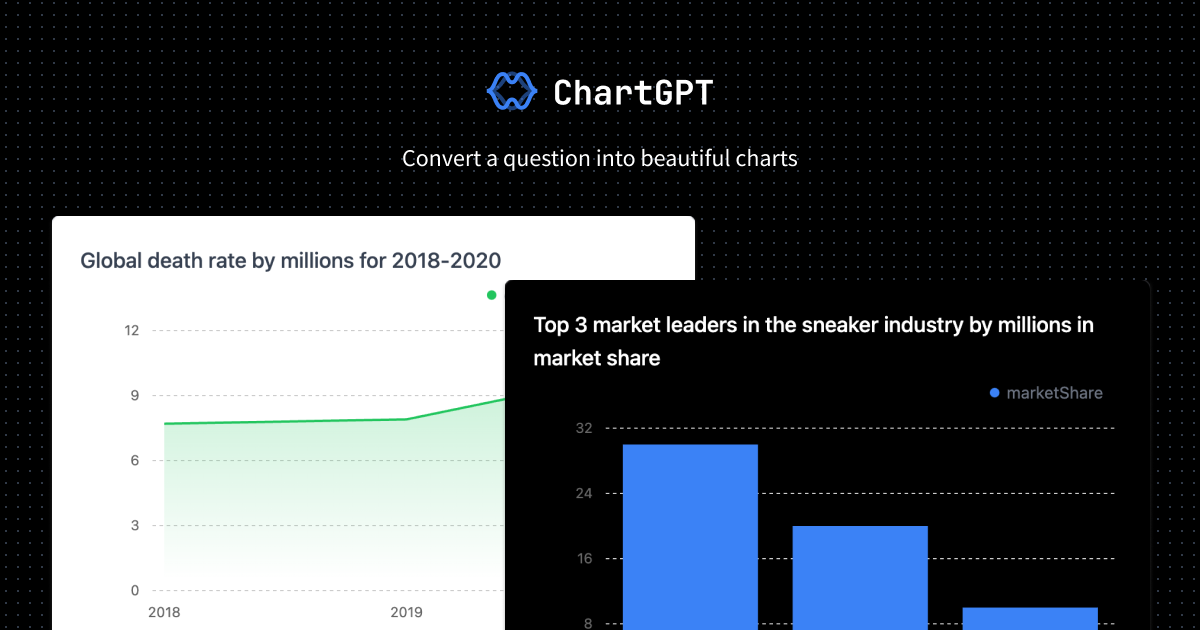
- Explore data visualization ideas like top market leaders in the sneaker industry, renewable energy source distribution in the US, or annual rainfall in major global cities.