Create and share beautiful and engaging annotated charts · contextualize.ai
Transform your data into captivating stories with @contextualize_ai's interactive annotated charts! 📊✨ Easily visualize historical trends, stock market fluctuations, and more without any coding required. Empower your storytelling with AI insights and customization options. #dataviz
- Create and share engaging, informative charts without coding.
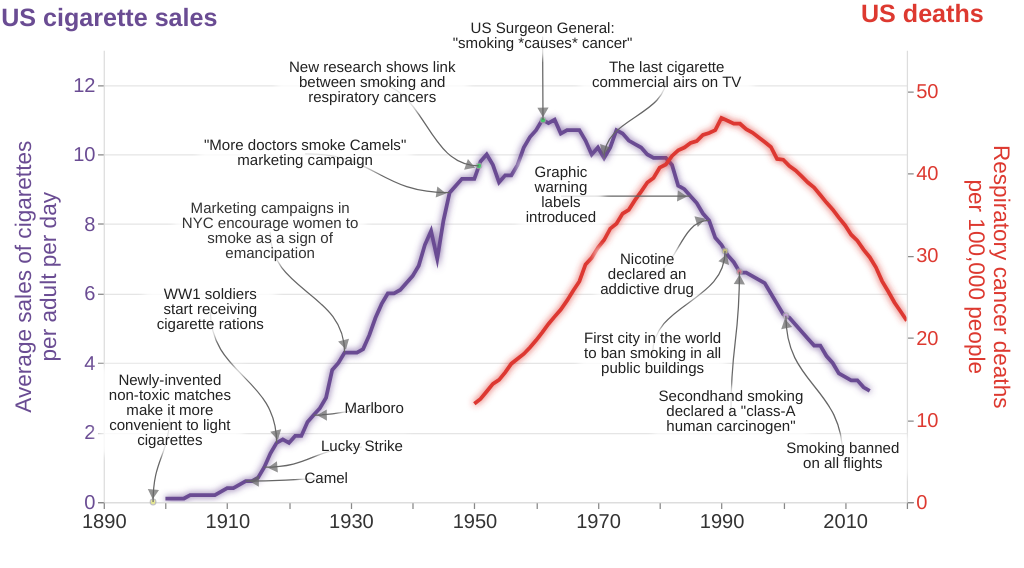
- Explore the history of cigarette sales and lung cancer deaths with data.
- Trace the evolution of smoking trends amid societal changes.
- Annotate key events like the Surgeon General's warning on smoking.
- Visualize stock market fluctuations like NVIDIA's journey with geopolitical impacts.
- Tell compelling stories through annotated charts effortlessly.
- Access AI insights on data ranges with integrations like Twitter and Google.
- Enjoy customization options for diverse chart styles and annotations.
- Benefit from a 30-day money-back guarantee on services provided.
- Empower storytelling through data visualization tools for effective communication.